
Study area
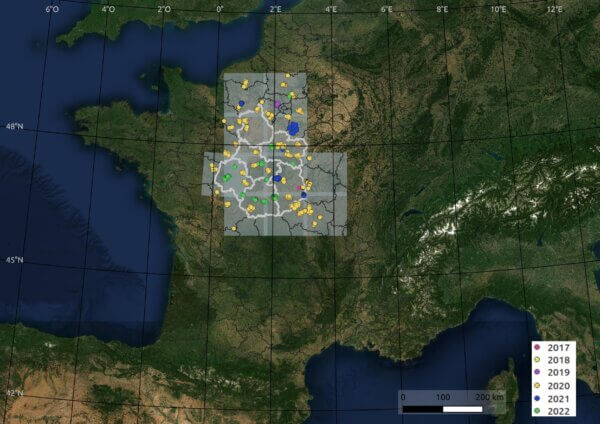
The study area for the RECONFORT project corresponds to the Centre-Val de Loire region and the surrounding area. The data comes from plots (20 trees) labelled between 2017 and 2022 using the DEPERIS protocol, used by the French Department of Forest Health (DSF). By taking into account the mortality rate of branches and the lack of branching, this protocol assigns a grade to a tree ranging from A (healthy) to F (dead). A grade of D corresponds to a dying tree, indicating a loss of more than 50% of its crown. The plots were then separated into 3 categories:
- Healthy (less than 20% of trees dying),
- Declining (between 20 and 50% of trees are declining),
- Very declining (+50% of trees declining).
In all, more than 2,700 reference plots were used, half of which were awarded the label in 2020 during a national survey conducted by the DSF.
Method
A system for operational monitoring of oak (sessile or pedunculate) dieback using satellite images has been developed by the University of Orléans (P2E laboratory) and CESBIO. This monitoring is carried out using Sentinel-2 satellite images, which have two major advantages: frequent shooting (approximately one image every 5 days) and a spatial resolution suitable for fine detection (pixels of 10 or 20 m).
The classification model used is called Random Forest. This is an artificial intelligence algorithm that automatically classifies examples into several categories. The input data used in this project are time series over two consecutive years of two vegetation indices derived from Sentinel-2 images. These two spectral indices were calculated from Sentinel-2 images and are complementary: the first is linked to the chlorophyll content and the second to the water content of the vegetation analysed.
To improve the stability of this prediction model (and therefore its performance), the training data was augmented using a simple and intuitive technique that can be summarised with the following two rules:
- Rule 1: a healthy plot in year Y was most likely healthy in years Y-1 and Y-2,
- Rule 2: a plot that was dying in year Y will most likely continue to die in years Y+1 and Y+2.
The processing chain created and used in this study is based on iota2 (developed at CESBIO). The use of iota2 makes it possible to have a production chain that is easily transferable and/or usable by different users. In particular, a package for producing dieback maps has been designed for this project and is freely available. The processing chain developed for learning a detection model for oak dieback is detailed in the figure below.
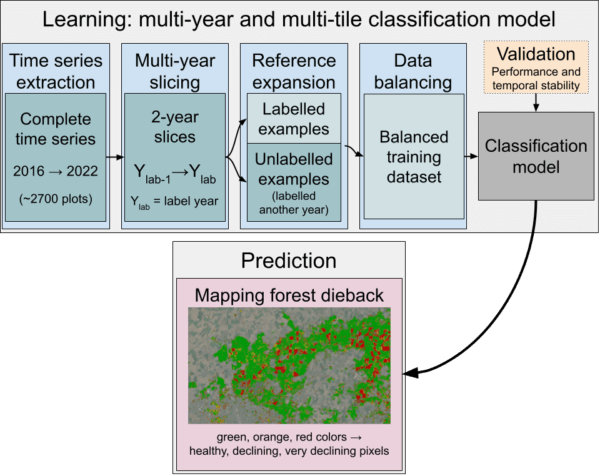
One of the special features of this approach is the development of a learning base enabling us to obtain a prediction model that can be used over several different years. This multi-annual approach is motivated by the desire to 1) take advantage of the availability of field references acquired over several years and 2) continue predictions in future years without needing to recalibrate the model learned.
Results
Validation results show that it is possible to accurately detect oak dieback (Good classification rate = 80%). The following figure, for example, shows the map produced for the year 2022 for the region and surrounding area.

It highlights the heterogeneous state of health within the region: the Sologne region in the center of the image, for example, is severely declining, while the north-west is little affected. These results should be treated with caution and are probably pessimistic, as the identification of oak stands is based on old data and clear-cuts could not be removed.


Development of predicted dieback between 2017 and 2022 in part of the Orléans forest (north-west). Homogeneous plots (in red) are visible and generally correspond to cuttings.
The figures above show in greater detail the spatial detail of the analysis and the temporal evolution of dieback in areas located in the state-owned forests of Orléans. In particular, we can see how rapidly and extensively dieback can change from one year to the next.
Outlook
This work highlights the value of Sentinel-2 imagery for systematic monitoring of forest health. Numerous prospects and avenues for improvement are possible. In particular, it would be interesting to automate the data augmentation stage to replace the rules currently applied. A move to a national scale could also be envisaged, given the relative robustness of the model for prediction over several years and over areas outside the learning region. Switching to a leafy model, not specific to oak, could also provide a more generalized product. Finally, the addition of Sentinel-1 images is another interesting avenue of research to assess whether the complementarity between the two satellites is relevant to our use case.
For more details on the results of this project, a scientific article has been published and a note has been put online on the website of our partner CESBIO.
Thanks
Our warmest thanks go to the iota2 team at CESBIO (A. Vincent, H. Touchais, M. Fauvel, J. Inglada, etc.) and to CNES. We would also like to thank the various participants in the RECONFORT project (non-exhaustive list): ONF (J. Mollard, A. Jolly, M. Boulogne), CNPF (M. Chartier, J. Rosa), Unisylva (E. Cacot, M. Bastien), DSF (T. Belouard, FX. Saintonge, S. Laubray), INRAE (JB. Féret, S. Perret) and EI de Purpan (V. Cheret and JP. Denux).